Skip to content
ServicesOur WorkAboutHow We WorkInsights
Discuss Your Project
HomeServicesOur WorkAboutHow We WorkInsights
Discuss Your Project
Byte Harbor Inc.

Technology built around your business. Websites, custom software, e-commerce and practical AI automation, from strategy to launch and beyond.

Based in Calgary, ABWorking with clients across Canada and the US

hello@byteharbor.ca

Services

  • Website Development
  • Custom Software
  • E-commerce
  • AI & Automation
  • Integrations
  • Next.js Development

Company

  • Our Work
  • About
  • How We Work
  • Insights

Start

  • Discuss Your Project
  • All Services
© 2026 Byte Harbor Inc. All rights reserved.Privacy PolicyBack to top
Home/Our Work/Financial health monitor & revenue ledger
Dashboard

Financial health monitor & revenue ledger

Know where every dollar is: earned, billed and paid.

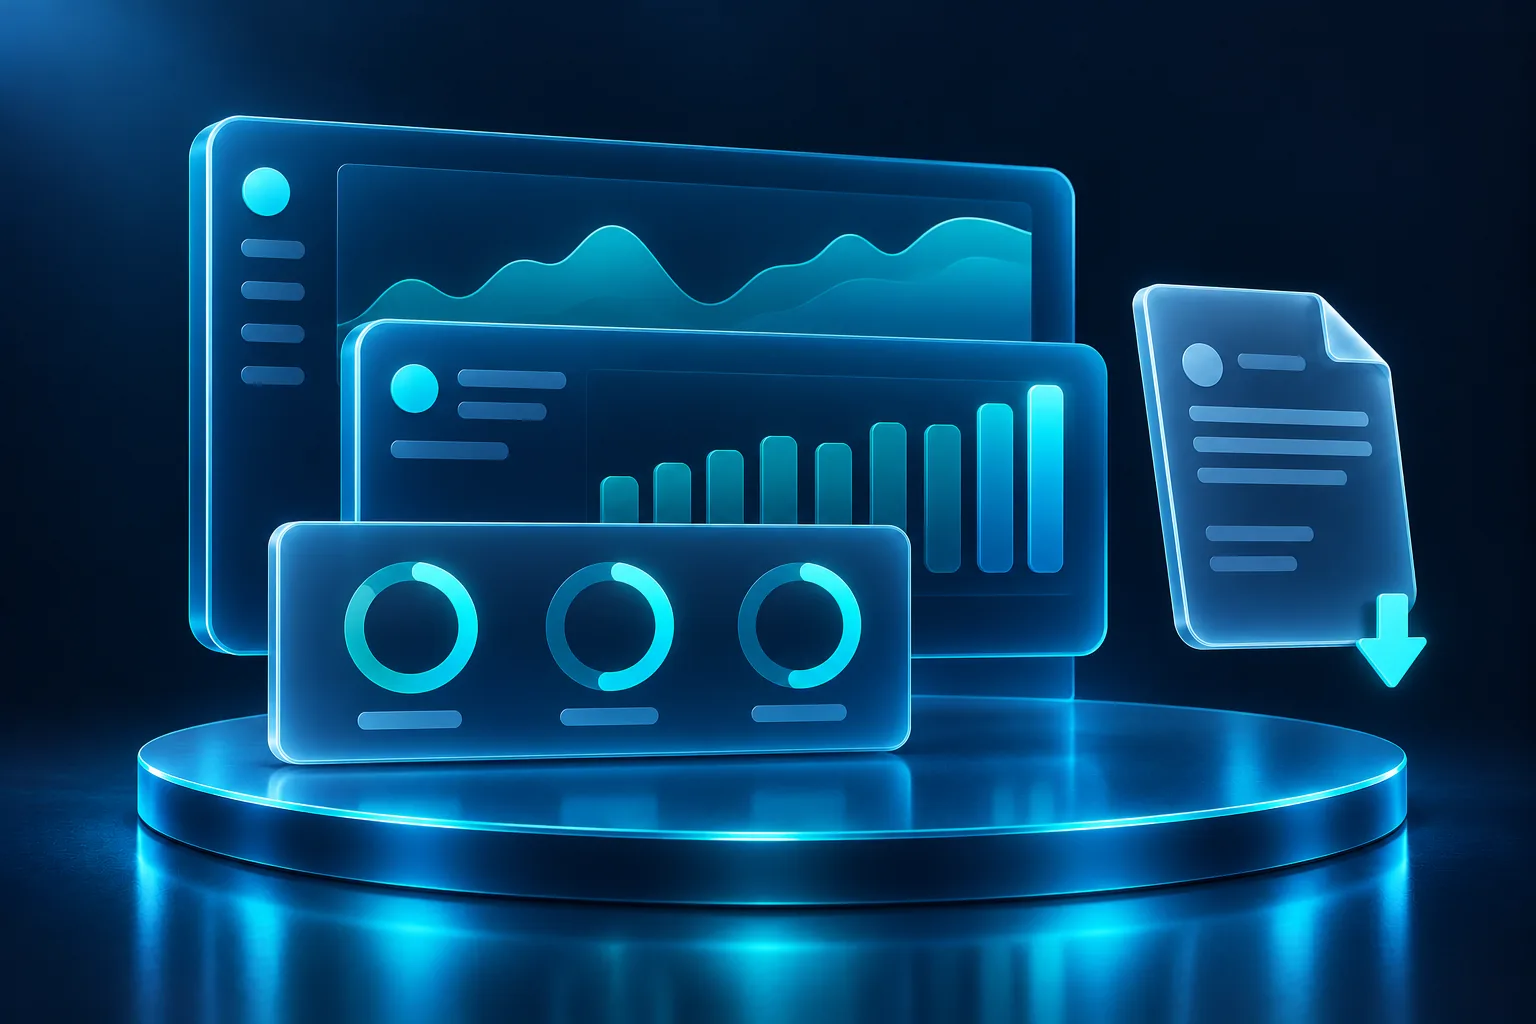
Illustration for Financial health monitor & revenue ledger

Overview

The challenge

Leadership needed to know whether billing was healthy and where every dollar stood, without waiting for month-end reconciliation or digging through spreadsheets.

Our approach

We built a financial health monitor and revenue ledger with automated checks, plain-language findings and drill-down to the exact rows behind every number.

Project type
Dashboard
Client
Confidential

Built with

  • React
  • Postgres
  • pg_cron
  • pg_trgm
  • Vitest

Standout features

  • 67 automated checks rolled up into a green, amber or red health board
  • A monthly ledger that drills down to the exact rows behind any number
  • ⌘K global search where every ID becomes a clickable name

Everyday impact

Problems surface the day they happen instead of at month-end.

What we built

Inside the system

  • Health board

    Green, amber or red status for each financial domain, with a priority alert strip on top.

  • Findings with explanations

    Filterable, searchable findings explain what each problem means and who should fix it.

  • Monthly revenue ledger

    Earned, billed and paid by source, plus payouts, with drill-down to the underlying records.

  • 67 automated checks

    Checks are generated from code into database migrations and run on a schedule.

  • ⌘K global search

    Every ID resolves to a clickable name that opens a detail panel.

  • Quality guardrails

    Automated contrast checks for both themes and UI-guard tests keep the interface consistent.

How it works

From start to finish

  1. 01

    Scheduled checks scan billing and payment data.

  2. 02

    Results roll up into a health board by domain.

  3. 03

    The ledger shows the money flow month by month.

  4. 04

    Anyone can drill from a total down to the exact rows behind it.

Services behind this project

  • Custom Software & Web ApplicationsTeams whose processes have outgrown off-the-shelf tools.
  • AI & Business AutomationTeams that want AI to take on routine work safely, with clear review and visibility.

More work

Related projects

View all work
  • Illustration for Multi-tenant partner portal
    Dashboard

    Multi-tenant partner portal

    Each partner sees their own results, and nothing else.

    Standout features

    • Strict per-organization data isolation
    • Outcome analytics: milestone funnels, trends and survey scores with flexible filters
    • Achieved milestones turn into invoices automatically

    Everyday impact

    Partners serve their own reporting, and invoicing no longer lives in a spreadsheet.

    Built with

    • React
    • Supabase
    • Recharts
    • Playwright
    • Vercel
    View project : Multi-tenant partner portal
  • Illustration for Operations & analytics dashboard
    Dashboard

    Operations & analytics dashboard

    50+ operational views across billing, commissions and communications.

    Standout features

    • Payment and eligibility files imported straight into billing dashboards
    • A commission and payout planner with personal earnings views
    • A communications workspace with templates, segments, logs and analytics, plus PDF export

    Everyday impact

    Questions that used to need a data pull are answered on screen.

    Built with

    • React
    • TanStack Query
    • Recharts
    • Supabase
    • jsPDF
    View project : Operations & analytics dashboard
← All workNext: Multi-tenant partner portal

Start a conversation

Facing a similar challenge?

Tell us what you’re trying to build. We’ll talk through how we’d approach it and what a sensible first step looks like.


Discuss Your Project